The numbers that mattered: Richmond

0 Home games that NC State head coach Dave Doeren has lost as a head coach. He is 14-0 at home as a head coach overall and 2-0 at NCSU.
0.9 NCSU limited the visiting Spiders to an average of 0.9 yards per rush, while they ran at a clip of 4.6 yards per attempt.
Advertisement
1 Junior kicker Niklas Sade is tied for first nationally with an average of 3.5 field goals made per contest. He is a perfect 7-of-7 on the year with a long of 48 yards.
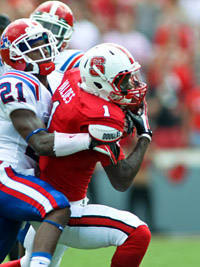
T-1 True freshman running back Matt Dayes is tied with three other freshmen to lead all rookie position players in scoring with an average of 12.0 points per contest.
2 True freshman Marquez Valdes-Scantling has started the first two games of his collegiate career and paced the Pack in receiving yards for each contest. He has totaled 12 catches for 174 yards, which is the second-highest yardage total in the nation for a true freshman and ranked No. 42 overall.
4 The Wolfpack topped Richmond despite turning the ball over four times.
6 The NCSU defense has forced eight fumbles and recovered six this year, which leads the nation.
7 Redshirt junior quarterback Pete Thomas converted on seven third-downs in the Richmond game, including three from rushes by Thomas, who is not known for his wheels. He also picked up a fourth-down conversion on the ground.
8 Defensive tackles Thomas Teal, Carlos Gray, T.Y. McGill and Monty Nelson have combined for 21 tackles, including eight tackles for loss and three sacks, as well as one forced fumble and a fumble recovery.
9 Sade is ranked ninth nationally in scoring with an average of 13.5 points per game.
10 Different receivers have already recorded a reception after two games — Valdes-Scantling and senior Rashard Smith are tied for the team lead with 12 catches apiece.
13 Touchbacks recorded on 15 kickoff attempts by Sade.
14 The Pack defense is ranked 14th nationally after allowing an average of just 79.5 rushing yards per contest.
15 Tackles for loss recorded by the Pack defense in the season's first two games.
18 Senior linebacker Robert Caldwell paces the defense with 18 stops on the year; he had a team-best 13 against Richmond.
33 Sade hit the game-winning field goal with 33 seconds left to give him clinching kicks in back-to-back seasons; he hit a 43-yarder with 32 seconds left in the win at Maryland last season.
34:52 Is NCSU's average time of possession, which is ranked 13th nationally.
78 Richmond totaled just 78 yards in the second half against State after they totaled 244 yards in the opening two quarters. They were limited to minus-19 yards in their first three drives after the break.
148 Smith's average of 148.0 all-purpose yards per game is tied for 34th in the country.
174 Dayes is tied with classmate Valdes-Scantling for second on the team with 174 all-purpose yards. The runner has totaled four touchdowns through two games.
263.2 Rookie wildcat quarterback Bryant Shirreffs has a passer efficiency of 263.2 after he completed all three of his first collegiate pass attempts for 19 yards and a score last week. He has also rushed 13 times for 70 yards and a touchdown on the year.
493.0 The Pack averages 493 yards of offense per game, including a clip of 212.5 yards on the ground per contest.
2000 Shirreffs was the first NCSU true freshman to tally a scoring throw since Philip Rivers in 2000.
Inside the numbers: Participation and starts by signing class
Note: Transfers are included with the year they joined NC State. For example, Pete Thomas is counted as a member of the 2012 class and Brandon Mitchell is included with the 2013 class.
Starters vs. Richmond by class:
2009 - 4 (2 offense, 2 defense) - 18.2%
2010 - 7 (3 offense, 4 defense) - 31.8%
2011 - 5 (1 offense, 4 defense) - 22.7%
2012 - 3 (2 offense, 1 defense) - 13.6%
2013 - 3 (3 offense) - 13.6%
***All 3 specialists are from the 2011 class, but not counted above***
Starters this year
2009 - 10 (5 offense, 5 defense) - 22.7%
2010 - 15 (7 offense, 8 defense) - 34.1%
2011 - 9 (2 offense, 7 defense) - 20.5%
2012 - 4 (2 offense, 2 defense) - 9.1%
2013 - 6 (offense) - 13.6%
***All 3 specialists are from the 2011 class, but not counted above***
Offensive participation vs. Richmond by class:
2009 - 5
2010 - 6
2011 - 1
2012 - 2
2013 - 5
Defensive participation vs. Richmond by class:
2009 - 3
2010 - 4
2011 - 8
2012 - 6
2013 - 2
Offensive and defensive participation vs. Richmond by class:
2009 - 8
2010 - 10
2011 - 9
2012 - 8
2013 - 7
Special teams only participation vs. Richmond by class (total that played in game):
2009 - 1 (9)
2010 - 1 (11)
2011 - 5 (14)
2012 - 3 (11)
2013 - 3 (10)
Percentage of offensive plays by class vs. Richmond (season total):
2009 - 24.0% (24.7%)
2010 - 31.6% (30.4%)
2011 - 8.8% (10.2%)
2012 - 11.4% (9.8%)
2013 - 24.2% (25.0%)
Percentage of defensive plays by class vs. Richmond (season total):
2009 - 17.2% (17.9%)
2010 - 29.1% (26.9%)
2011 - 41.2% (40.5%)
2012 - 8.4% (10.7%)
2013 - 4.0% (4.0%)
Percentage of overall plays by class vs. Richmond (season total) - offense and defense only:
2009 - 20.6% (21.6%)
2010 - 30.3% (28.8%)
2011 - 25.1% (24.2%)
2012 - 9.9% (10.2%)
2013 - 14.1% (15.3%)